Monitoring Neon with external tools
Monitor your Neon Postgres database with external tools such as PgAdmin or PgHero
There are external tools that you can use to monitor your Neon Postgres database, such as PgHero and pgAdmin. Setup instructions for those tools are provided below.
note
Neon does not currently support monitoring tools or platforms that require installing an agent on the Postgres host system, but please keep an eye on our roadmap for future integrations that enable these monitoring options.
PgHero
PgHero is an open-source performance tool for Postgres that can help you find and fix data issues, using a dashboard interface.
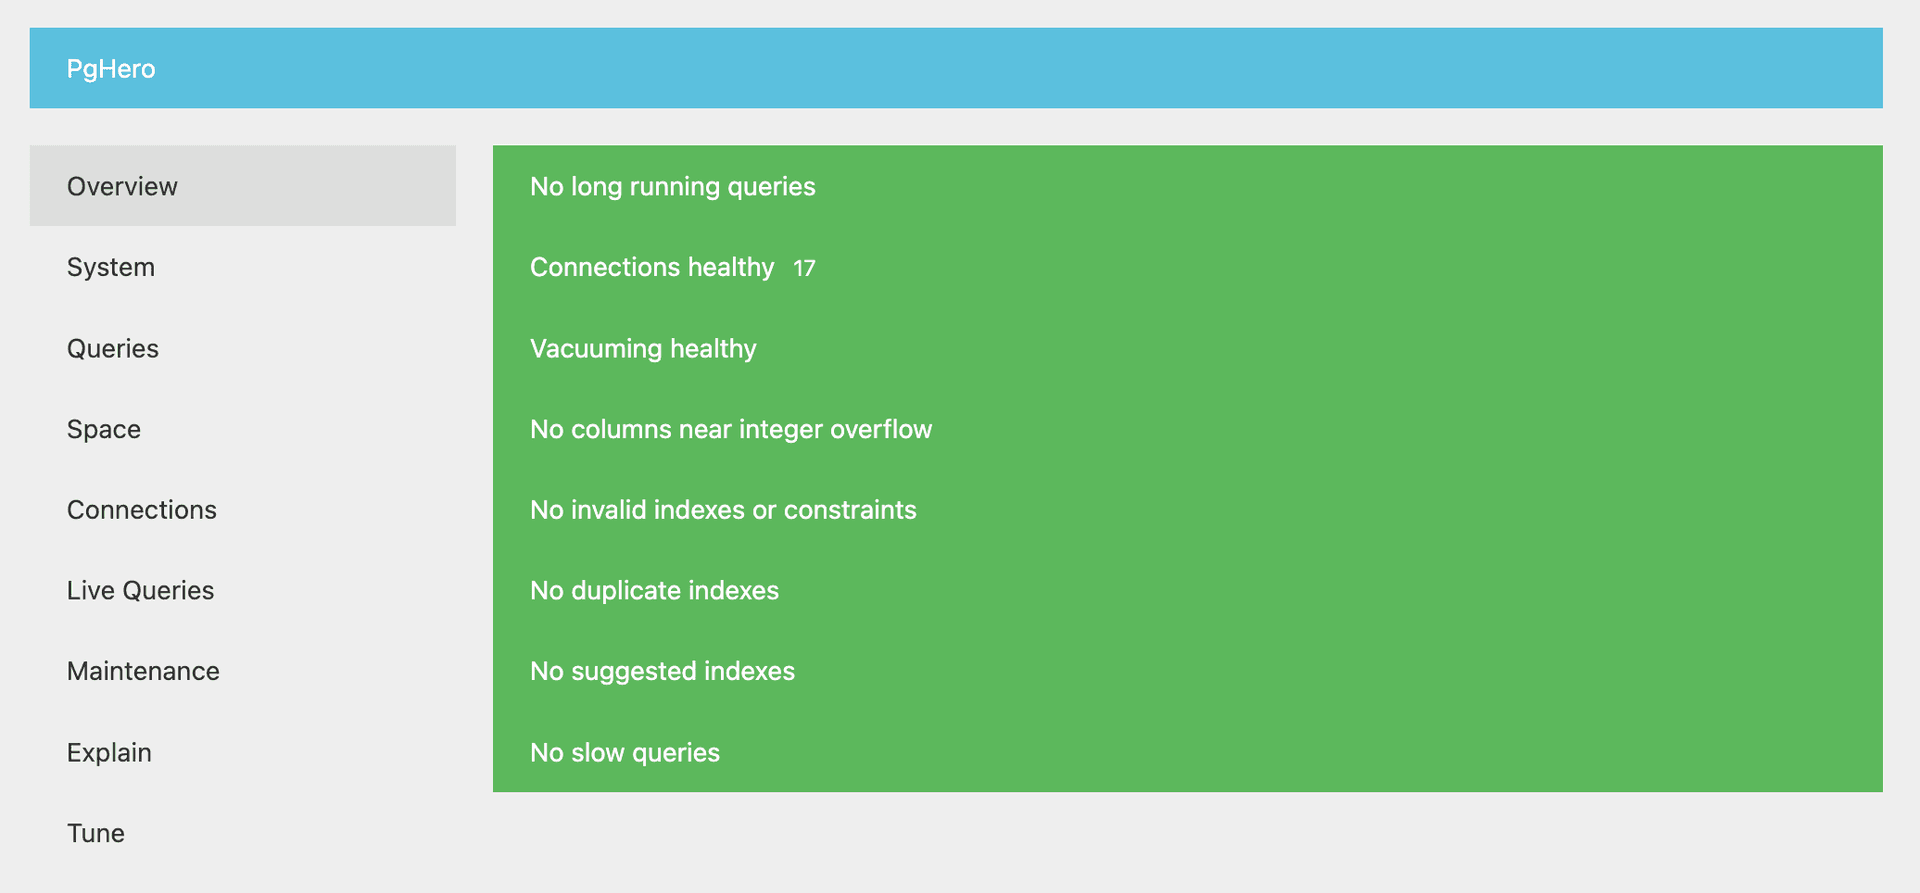
A quick look at the interface gives you an idea of what you’ll find in PgHero.

Among other things, you can use PgHero to:
- Identify long-running queries
- Identify tables that require vacuuming
- Identify duplicate or missing indexes
- View connections by database and user
- Explain, analyze, and visualize queries
How to install PgHero
PgHero supports installation with Docker, Linux, and Rails. Here, we’ll show how to install PgHero with Docker and connect it to a Neon database.
Before you begin:
- Ensure that you have the pg_stat_statements extension installed. PgHero uses it for query stats. See above.
- Ensure that you have Docker installed. See Install Docker Engine for instructions.
PgHero is available on DockerHub. To install it, run:
docker pull ankane/pgheroHow to connect to your database from PgHero
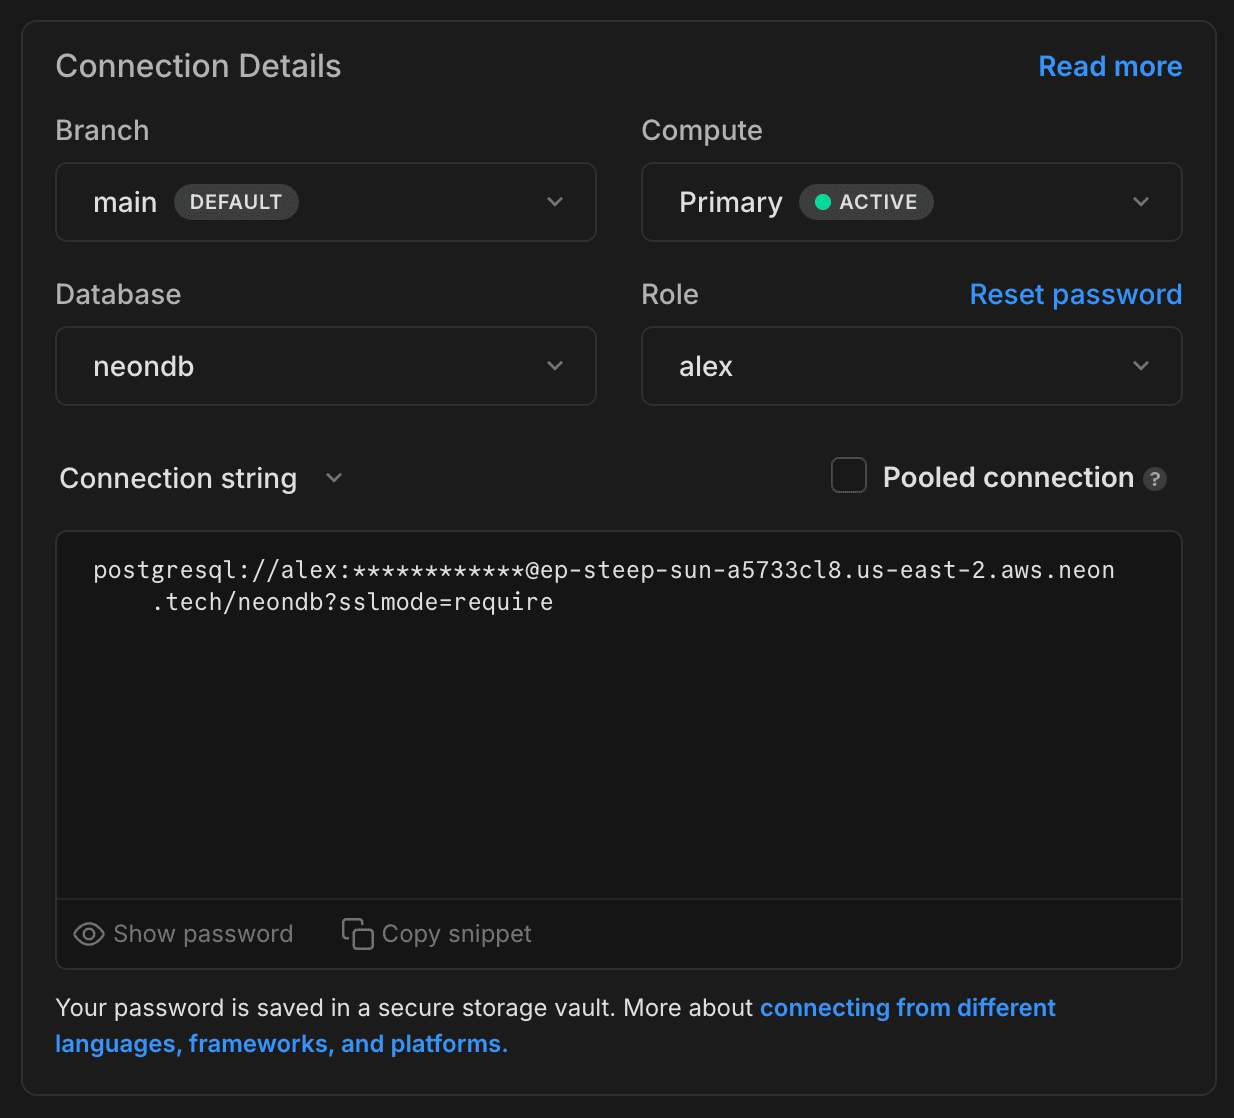
Grab your Neon database connection string from the Connection Details widget in the Neon Dashboard.

Finally, run this command, replacing $NEON_DB with your Neon database connection string.
docker run -ti -e DATABASE_URL='$NEON_DB' -p 8080:8080 ankane/pgheroThen visit http://localhost:8080 in your browser to open the PgHero Dashboard.
pgAdmin
pgAdmin is a database management tool for Postgres designed to facilitate various database tasks, including monitoring performance metrics.

With pgAdmin, you can monitor real-time activity for a variety of metrics including:
- Active sessions (Total, Active, and Idle)
- Transactions per second (Transactions, Commits, Rollbacks)
- Tuples in (Inserts, Updates, Deletes)
- Tuples out (Fetched, Returned)
- Block I/O for shared buffers (see Cache your data for information about Neon's Local File Cache)
- Database activity (Sessions, Locks, Prepared Transactions)
Notes
Neon currently does not support the system_stats extension required to use the System Statistics tab in pgAdmin. It's also important to note that pgAdmin, while active, polls your database for statistics, which does not allow your compute to suspend as it normally would when there is no other database activity.
How to install pgAdmin
Pre-compiled and configured installation packages for pgAdmin 4 are available for different desktop environments. For installation instructions, refer to the pgAdmin deployment documentation. Downloads can be found on the PgAdmin Downloads page.
How to connect to your database from pgAdmin
Grab your Neon database connection string from the Connection Details widget in the Neon Dashboard, as described above.
Enter your connection details as shown here.
Neon uses the default Postgres port: 5432
Need help?
Join our Discord Server to ask questions or see what others are doing with Neon. Users on paid plans can open a support ticket from the console. For more detail, see Getting Support.